-
Why Soldo
-
Decentralised SpendControl company spending in one place
-
Liberate Finance Accomplish MoreReduce admin, focus on strategy
-
Progressive Finance ApproachSmarter, more agile financial management
-
The Soldo DifferenceBuilt for flexibility and scalability
-
Soldo Financial ServicesNot reliant on 3rd party financial solutions
-
Security & PrivacyEnterprise grade protection and compliance
-
-
Progressive Solutions
-
Business NeedsHow Soldo can benefit your business.
-
-
Centralise Decentralised SpendControl all spending in one place
-
Business & Finance AgilityFaster, smarter financial control
-
More Accurate ForecastingSmarter insights, better planning
-
Easier Month-endsClose books faster, stress-free
-
Increase ProductivitySpend less time on admin
-
Ensure ComplianceStay audit-ready, effortlessly
-
Track Sustainability GoalsMonitor and manage ESG impact
-
Expense & Company CardsFlexible, controlled business spend
-
-
-
IndustrySome key industries we are in.
-
-
Fashion RetailTrack budgets across stores
-
Food & BeverageMaintain budgets at every branch
-
Property & Facilities ManagementSee property expenses live
-
Machinery ManufacturingOptimise supply and production spend
-
Media ProductionManage on-set and remote expenses
-
Social Care GroupsManage care facility expenses easily
-
ConstructionControl project and site spending
-
EducationStreamline school and university costs
-
-
-
Company SizeWhich represents your company size?
-
Role or FunctionWhat do you do for work?
-
-
CFO & Finance LeadersStrategic control of company spend
-
Finance TeamsSimplify spend management
-
Finance TransformationModernise and automate finance
-
Operations & ProductionOptimise costs and efficiency
-
ProcurementSmarter purchasing decisions
-
Human ResourcesManage team expenses easily
-
MarketingTrack and control campaign spend
-
-
-
-
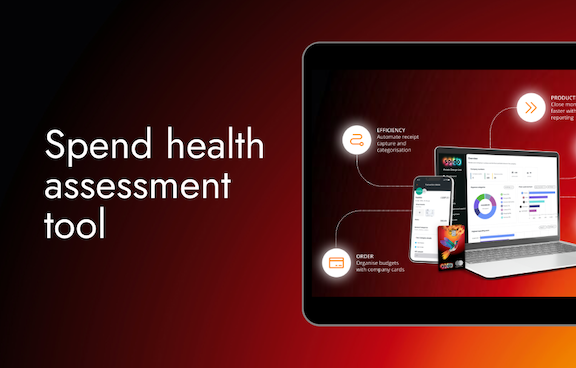
Product & Ecosystem
-
One Ecosystem forHow Soldo can transform your business
-
Management PlatformHow Soldo’s management platform helps you
-
-
Spend ControlsEnforce policies & limits
-
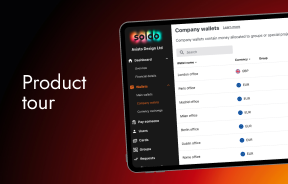
BudgetsAllocate ring-fenced funds
-
Teams & EntitiesAlign spend with hierarchy
-
Requests & ApprovalsEmpower teams to request funds
-
Expense ReviewAutomate approvals & expenses
-
Accounting AutomationSync spend with accounting
-
Reporting & AnalyticsGet clear spend insights
-
-
-
Payments & CardsWe cover a variety of payment methods
-
Mobile AppOn-the-go solutions
-
Integrations & APIsConnect spend data across your systems
-
-
IntegrationsConnect your financial systems
-
Accounting IntegrationsSpeed up reconciliation and reporting
-
ERP IntegrationsConnect business systems for one source of truth
-
HR IntegrationsSync employee and spend data
-
T&E IntegrationsSimplify business travel expenses
-
eCommerce IntegrationsTrack and reconcile your eCommerce spending
-
Custom IntegrationsFlexible options for any system
-
-
-
Professional ServicesUnlock the power of Soldo
-
-
Resources